Wednesday, January 3, 2018

ADF performance tuning: Whitepaper published on the ADF Performance Monitor

The ADF Performance Monitor is an application performance management tool (APM) tool that really understands Oracle ADF applications. Web applications often contain frustrating blind spots and mysterious, recurring problems that are often difficult to identify, diagnose, and fix. The ADF Performance Monitor helps enterprises by delivering insight into real end-user experiences. It helps development, QA teams and administrators detect, analyze and resolve common and less common issues in response times and resource usage of ADF applications.


This blog publishes a new whitepaper that gives detailed information about the architecture and implementation of the ADF Performance Monitor.

History


The first version of the ADF Performance Monitor was created by Frank Houweling and released in 2009. This was first an ADF 10g version; this version consisted of printing performance metrics in JDevelopers console log only (what methods, operations and queries were executed, when and how often). The urgent need of performance visibility came back every time in somewhat all Oracle ADF projects; nearly all ADF applications had performance problems in some way and extreme difficulty in identifying these bottlenecks.


One year later (2010) the second version was released including saving metrics to the database. In 2011 a dashboard application was added that visually reported the performance metrics saved in the database. Last years the monitor has been extensively improved and extended with many new and advanced features.

Over last years the ADF Performance Monitor has been implemented in more than 50 Oracle ADF business production applications – in more than 25 countries in the world; for example in the Netherlands, Germany, Belgium, United Kingdom, France, Spain, Canada, United States, Switzerland, Austria, Romania, Poland, Libanon, Sultanate of Oman, India, China, Australia, Cuba, Mexico, e.g.

New whitepaper published

Whitepaper ADF Performance Monitor - this document gives more information about the architecture and implementation of the ADF Performance Monitor.


Content of the whitepaper:

  • Executive overview
  • Introduction
  • Oracle ADF applications and performance
  • ADF Performance Monitor overview
  • Use in JDeveloper
  • Use in test and production environment
  • Dashboard reporting application
  • Summary and details HTTP response times
  • ADF framework call stack
  • Warnings and suggested solutions
  • Worst performing executions in ADF BC and model layer
  • Error stacktraces
  • JVM performance
  • Product architecture
  • Configuration
  • Turn on/off at all times
  • Prerequisites
  • Monitored Events

Functionality

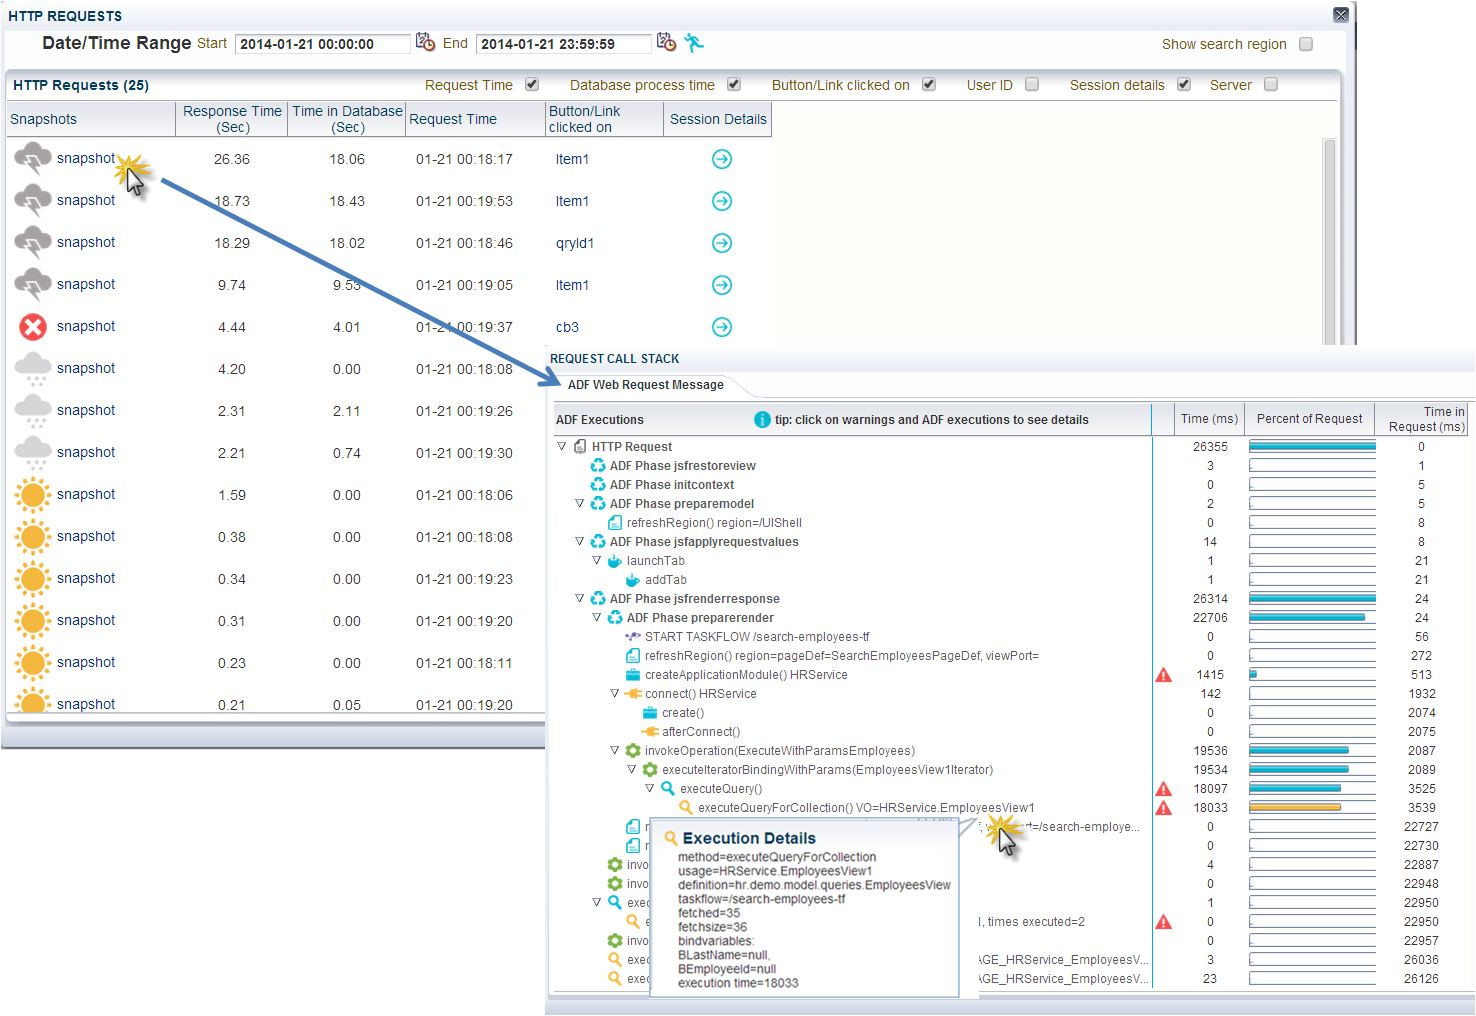
In development, test and production environments, the ADF Performance Monitor provides similar functionality as the callstacks of the Oracle ODL Analyzer (by ADF request). The Oracle ODL Analyzer can be useful in the development stage, but can’t be used in test en product environments because of the amount of logging generated and the significant performance overhead. The ADF Performance Monitor records the performance with a very low overhead (less than 4%, caused by the detailed collection of performance metrics). An example of a callstack in the ADF Performance Monitor is shown in the image below. In this case the bottleneck is a slow ViewObject query of 18033 milliseconds (with usagename HRService.EmployeesView1):


In addition to that, the monitor reports overviews of the worst performing ADF Business Components (shown in the image below), BindingContainer and webservice executions and the possibility to drill down. Extensive help is available in the monitor on how to interpret the metrics. Also JVM metrics and application errors are reported. SLA monitoring (load and HTTP request response times) is possible. Because of the low performance overhead, it is safe to use the ADF Performance Monitor in production environments. The metrics collection can be dynamically turned on and off (at runtime) at all times. When the monitor is turned off there is no performance overhead because the metrics classes are not active. More detailed information is available in the whitepaper published in this blog.


With the ADF Performance Monitor, development, QA and operation teams get insight into what is happening inside their ADF application throughout the whole application lifecycle. With this insight they can circumvent frequent performance problems, use best practices and deliver a responsive and scalable ADF application.


More information

More information is available on www.adfpm.com.

Friday, May 12, 2017

ADF Performance Tuning: Tips on How to Limit ADF BC Memory Consumption

This blog contains tips and tricks on to how limit the JVM memory consumption of ADF applications. Like other web applications, Oracle ADF applications potentially use a lot of JVM memory. Many times, the root cause of a high memory usage is that application data retrieved from the database into memory is not properly bounded; too many rows are fetched and held in ADF BC memory. This can lead to memory over-consumption, very long running JVM garbage collections, a freeze of all current requests or even OutOfMemoryErrors. To make matters worse, these rows and their attributes are frequently passivated and activated for an unnecessary long period of time. The solution to this problem can be found in reducing the size of sessions by decreasing of the amount of data loaded and held in the session. With a low memory consumption, a more responsive, stable and scalable ADF application can be delivered.


Long JVM garbage collections

A ‘happy JVM’ is important. If garbage collections are running very long (for example more than 30 seconds), this is often an indication of a problem – such as a freeze of all current requests because the JVM cannot clear enough memory. In the image below an example is shown of very long running garbage collections (red line). The heap space (blue) over time evolves more into a horizontal line than the saw-tooth shaped line a healthy JVM would be characterized by. In this case an OutOfMemoryError occurred and the server needed to be restarted. This should be a trigger to investigate whether the JVM heap space is set too low or that the ADF application consumes too much memory.


Root cause of memory overload

When the JVM heap space is set at a reasonable value, the root cause of memory over-consumption is often that the ADF application fetches far too many rows (and too many attributes – I will address this subject in another blog).


This can happen when the ViewObject SQL query potentially has access to thousands or even hundreds of thousands of database rows and it does not have (or not enough) restricting bind variables (or when no ViewCriteria is applied).

Further (one or more):

  • An af:table, af:treeTable, af:tree component is used in a page and the underlying ViewObject’s Access Mode is Scrollable (this is the default value at the ViewObject tuning section)

  • The iterators RangeSize property (in the PageDefinition file) is set to -1

  • The ViewObject fetchSize is set to All Rows – (All at Once)

  • A ViewObject is only used for inserting new records (and its fetchsize is still set at the default value All Rows – (As Needed) - it can still execute its SQL query (and unintentionally fetch all database rows that are accessible)

  • Iterating in Java through all ViewObject rows


Limiting rows fetched in ADF BC memory

Range paging

ADF ViewObjects provide a mechanism to page through large data sets so that a user can navigate to a specific page in the results. Range Paging fetches and caches only the current page of rows in the ViewObject row cache (at the cost of another query execution) to retrieve each page of data. Range paging is not beneficial for small data sets where it is better to have all fetched rows in the ViewObject row cache. With Range paging you can say: “I would like to see page 9 of the search results (and 10 per page)”:

  • R = Range size (rows per page)
  • P = Page number of the result

You can set the ViewObject Access Mode to Range paging in the ViewObject tuning section:


Maximum fetchsize on ViewObject

It is very important to limit the impact of non-selective queries that may return thousands of rows is setting a maximum fetchsize on the ViewObject instance. Recommend values are:

  • Table-layout:    Only up to row number:  Set this to ± 250 rows and set a proper fetchSize (or use Range Paging)
  • Form-layout:    At Most One Row (for dedicated ‘single row’ ViewObjects, when the ViewObject is being used only in the context of a single row (like the form part of a table/form layout). When a table row of a table/form layout is selected or clicked on, the form layout ViewObject is queried  with its ID value as bind parameter (for example with the executeWithParams operation). For table/form layout it is a good practice to create two separate fysical ViewObjects for table and form, especially when the table can fetch more than ± 250 rows database rows.
  • Insert-layout:  No Rows (for Insert-only View Objects, when you know the Viewobject is being used only in insert mode)

An excellent way to prevent loading too much (database) rows is to set a global maximum fetchsize. You can set a global Row Fetch Limit in ADF META-INF/adf-config.xml:


If you do want to set a higher or smaller maximum fetchsize for individual ViewObject instances, you can still set a different value at the tuning section of an instance and override the global threshold. It is recommended to think carefully for each ViewObject what the best value is.


Extra bind variables on ViewObject

If your ViewObject fetches/loads a large dataset, you can limit it with extra bind parameters (or extra ViewCriteria). For example, on a search screen end-users must fill in extra mandatory search fields that correspond to extra bind parameters, to make the database query resultset smaller.

Alternatively, before you execute the ViewObject query of an import (search) screen that has access to thousands of rows you can first execute a select COUNT that gets the number of rows returned by the query.


If the number of rows exceeds a certain threshold (for example 250 rows), a message can be shown to the end user that too many results are found and that more refined, specific search terms or date restrictions are required. Only if the number of found results does not exceed the threshold, the query is executed, the database rows are fetched/loaded and the user gets the results.


Read-only ViewObjects

If a ViewObject does not have to insert or update data, use a more memory friendly read-only ViewObject;

  • Non updatable EO based ViewObject (deselect updatable in the ViewObject editor)
  • Expert-mode read-only ViewObject


ApplicationModule lazy loading

It is recommended to defer the runtime instantiation of ViewObject and nested ApplicationModule instances until the time they are used. You can set this in the ApplicationModule tuning section:


Shared ApplicationModule

Use a shared ApplicationModule to group view instances when you want to reuse lists of static data across the application.


ApplicationModule Pooling

When a ViewObject is properly tuned and limited in its fetching, only the rows really needed are being kept in memory. This is very important for performance and to keep the memory low. This will also make ApplicationModule pooling activations and passivations much faster. ApplicationModule pooling parameter settings are also very important for performance, I will address this in another blog.


Detecting an overload of ViewObject rows

One of the new features of the ADF Performance Monitor is a kind of ADF BC memory recorder and analyzer. It detects and warns when too many ViewObject (database) rows are being fetched/loaded into memory. Also, for a selected time range (month, week, day, e.g.), the tool gives aggregated overviews for each ViewObject instance how many rows have been fetched/loaded into ADF BC memory (ViewObject row cache or EntityCache). ViewObjects that frequently fetch hundreds or thousands of rows – and waste memory – can be detected. Also individual high fetches/loads can be analysed.


With this information, ViewObject instances that frequently fetch too many database rows can be addressed by the suggestions written in this blog; adding extra bind parameters, setting a (better) maximum fetchsize or using Range Paging.

Monday, April 3, 2017

ADF Runtime Diagnostics: Instrumenting your ADF Application - Part 2

In a series of blog articles I show how you can instrument your ADF Application key actions. Instrumenting gives visibility and insight of what is happening inside the ADF application and in the ADF framework (what methods and queries are executed, when and how often). These runtime diagnostics can be very effective in identifying and solving performance issues. This enables developers to diagnose and solve performance problems at an early stage and to build an efficient, responsive ADF application before it goes into production. Part one was about instrumenting the ADF ViewObject. In this blog, part two, I will discuss instrumenting the ADF BC ApplicationModule.

ADF BC framework extension classes

As discussed in part one, you can instrument your ADF application with the use of ADF BC framework extension classes and overriding specific methods to measure important key actions inside the ADF framework. For an ADF BC ApplicationModule you can create a metrics ApplicationModule (for example called MetricsApplicationModuleImpl) that extends from oracle.jbo.server.ApplicationModuleImpl. Your project base class can extend from this MetricsApplicationModuleImpl:

You can look at the ApplicationModuleImpl API doc for important and interesting methods to monitor.

Monitor ApplicationModule activation and passivation

As you know, ApplicationModule pooling enables multiple users to share several application module instances. It involves saving and retrieving session state data from the database, file, or Java memory. This mechanism is provided to make the application scalable and becomes very important under high load with many concurrent users. The default values can be very inefficient and may cause many unneeded passivations and activations. A quick and simple way to monitor passivations in ADF is to override the ApplicationModule method passivateState() in your metrics base class:

And to monitor activations override the ApplicationModule method activateState() in your metrics base class:

In this way you can monitor which ApplicationModules are activated/passivated, their activation/passivation time, when and how often it is executed.

You might detect very frequent and long running activations and passivations. With this information you can experiment en test with ApplicationModule pooling parameters. It is especially useful to monitor this during load tests to find your most optimal ApplicationModule pooling parameter settings. In most cases, unfortunately, the default values are not the most optimal values. Carefully read the documentation in the ADF Fusion developers Guide (Ch. 44 of the 11gR2) for more information about these parameter settings.
Other interesting ApplicationModule pooling methods are passivateStateForUndo and activateStateForUndo.

Monitor ApplicationModule creation time & database connecting time

We can configure a custom DefaultConnectionStrategy class to measure ApplicationModule creation time and database connecting time. Our custom class must extend oracle.jbo.common.ampool.DefaultConnectionStrategy. In the same way as we did before, we can measure the creation and connect time.

Configuration on the ApplicationModule:

in JDevelopers console log:

These methods are also interesting to monitor during a load test. For example, the connect() method could run very long when there are not enough database connections available, and it needs to wait for one. The next step could be to increase the maximum capacity in the datasource connection pool. Or to decrease the number of root ApplicationModules (and the number of database connections).

Monitor PLSQL calls

In the same way as described before you can instrument your PLSQL calls executed from your ApplicationModule. Frequently utility methods on the ApplicationModule are created for this purpose and they can be instrumented. You can log the execution time, the PLSQL statement, the ApplicationModule instance name, the IN and OUT parameters, e.g.

ADF Performance Monitor

The ADF Performance Monitor uses (amongst others) the extension points and methods described in this blog (and part one) to measure and record performance. It collects not only execution time but many additional metrics like ApplicationModule definition name, usage name, instance id, for which ViewObject data are being activated/passivated during an activation/passivation, e.g. . For every HTTP request a so called 'ADF call stack' is printed. These are the methods that we have overridden in our metrics class and other extension points in the ADF framework. The runtime diagnostics are available in JDeveloper and in a test/production environment. 
In the image below an example of a long running ApplicationModule activation of 22048 milliseconds (usage name HRService). 

As we can see, the slow activation is caused by activating the transient ViewObject attributes of HRService.LocationsViewRO in activateTransients(). We can see the value of instrumenting our ADF application and monitoring - now we can do something about the slow activation. For example to uncheck the  'Passivate State - Including All Transient Values' checkbox at the ViewObject tuning section for HRService.LocationsViewRO.
Shown below is an example of a long running ApplicationModule passivation of 3796 milliseconds (usage name of HRService). This is caused by the same ViewObject, that passivates its transient attributes (HRService.LocationsViewRO):

An example of a long running PLSQL statement and an ApplicationModule connect():

Worst ApplicationModule activations & passivations overview

In the ADF BC overview (filtered on ApplicationModule pooling) the ApplicationModule pooling performance can be analyzed. This overview gives more insight in the effect of these parameter settings (how often passivations and activations happen, how long their AVG and total execution time is). On each ApplicationModule activation/passivation can be drilled down, to see the ADF request call stacks. Dev and QA teams can research and experiment with these parameter settings on test environments during load tests and evaluate the performance results in the monitor. They can determine the most optimal ApplicationModule pooling parameter settings for their situation. Operation teams can monitor the ApplicationModule pooling behavior in production.

Total time of worst ApplicationModule activations & passivations

The performance impact of frequent invoked activations and passivations can be much higher than those that occur only a few times but are very slow on average. It is important to know which activations/passivations have the biggest impact on the resources of your ADF application. In this overview the x-as shows the AVG execution time (seconds) and the y-as shows the occurrences. The size of the bubble is total time (AVG execution time * occurrences).

Occurrences overview

The occurrences overview shows how often activations and passivations are executed:

We can see that PjtShowPaga001AM.passivateState, PjtShowPaga001AM.activateState and Pagd001AM.passivateState are executed very frequently. If we don't want this behavior, we can adjust the pooling parameter settings.
More information about the ADF Performance Monitor is available on www.adfpm.com


Sunday, March 12, 2017

ADF Runtime Diagnostics: Instrumenting your ADF Application - Part 1

In a series of blog articles I will show how you can instrument your ADF Application key actions. Instrumenting gives visibility and insight of what is happening inside the ADF application and in the ADF framework (what methods and queries are executed, when and how often). These runtime diagnostics can be very effective in identifying and solving performance issues. This enables developers to diagnose and solve performance problems at an early stage and to build an efficient, responsive ADF application before it goes into production. In this blog I will discuss instrumenting the ADF BC ViewObject. In part 2 the ApplicationModuleImpl is discussed.


ADF BC framework extension classes

You can instrument your ADF application with the use of ADF BC framework extension classes and overriding specific methods to measure important key actions inside the ADF framework. You can use your project base classes or create a dedicated metrics package with extension classes for performance analysis and tuning. For an ADF BC ViewObject you could create a metrics ViewObject (for example called MetricsViewObject) that extends from oracle.jbo.server.ViewObjectImpl. Your project base class can extend from this MetricsViewObject:


Monitor slow queries

You can measure exactly - like a stopwatch - the execution time of a Java method by retrieving the current nano time just before and immediately after the method execution by calling System.nanoTime(). System.currentTimeMillis() can be a few milliseconds inaccurate. See the API doc of System.nanoTime() and System.currentTimeMillis().

long startTime = System.nanoTime(); 
//method being measured ...
long estimatedTime = System.nanoTime() - startTime;

You can look at the ViewObjectImpl API doc for important methods to monitor.

A quick and simple way to monitor executed database queries in ADF is to override the ViewObject method executeQueryForCollection() in your metrics base class. In this way you can monitor which ViewObject queries are executed, their execution time, when and how often. You might detect redundant or unexpected ViewObject queries. With this method you can monitor all queries including queries from ViewAccessors, programmatic ViewObjects, detail queries from ViewLinks, e.g. ).


A ViewObject usage name that contains '_LOCAL_VIEW_USAGE' is a generated ViewAccessor name and is also just a ViewObject query. In JDevelopers console log:


The overriden executeQueryForCollection() method of the ADF Performance Monitor is shown in the image below. The monitor only measures when the monitor is turned on. It has a start-point, and an endpoint in a finally block:


The metrics are collected in a separate object MetricsVoExecution. Extra runtime metrics are collected like bind variable name and values, ViewObject definition name, fetched rows, e.g. to make the metrics even more useful. The execution time is measured in the superclass call super().


Monitor slow select count query

Frequently 'SELECT COUNT (1)' queries are executed by the ADF framework to count the number of rows that would be returned if the View Object is executed with the current query (mainly for tables and trees). This query could be a potential bottleneck if it takes very long to execute, and for this reason the method getQueryHitCount() is useful to monitor:


Monitor passivating and activating ViewObject transients

In the same way you can override the activateTransients() and passivateTransients() method. activateTransients() restores attribute values from a ViewObject (if there are transient attributes passivated) and passivateTransients() stores attribute values. Both methods can potentially take a lot of time if the Passivate State - Including All Transient Values checkbox is checked at the ViewObject tuning section:


Our performance logging in JDevelopers console log can look like this (I put a delay in the query of the EmployeesView ViewObject of 15 seconds) looks like this:


You might want to look at the ViewObject API to override other interesting methods as well. You can consider to only log metrics when the execution time passes a configurable threshold.


Monitor fetched rows from the database

In my previous about detecting a high ADF BC memory consumption I explained how you can instrument and measure how many rows are fetched from the database, and how many ViewObject rows are created and cached. The most important method to override is createRowFromResultSet() and counting them in the MetricsViewObjectImpl or BaseViewObjectImpl. Reset the counter before a query is executed (again).


A high load can now be detected in JDevelopers console log. You might want to not log every single row that is fetched but only when you detect a high load.


ADF Performance Monitor

The ADF Performance Monitor uses (amongst others) the extension points and methods described in this blog to measure and record performance. It collects not only execution time but many additional metrics like  bind variable name and values, ViewObject definition name, fetched rows, time spent fetching database rows, e.g. . For every HTTP request a so called 'ADF call stack' is printed. These are the methods that we have overridden in our metrics class and other extension points in the ADF framework  (in the next parts I will discuss many of them). A call stack provides visibility into which ADF methods caused other methods to be executed, organized by the sequence of their execution.  A complete breakdown of the ADF request processing, including all ADF method executions, along with elapsed times is printed, organized by lifecycle phase. ADF developers can switch the metrics logging on and off with the standard ADFLogger of Oracle. The logging of the ADF Performance Monitor in JDeveloper looks like this (for use in a development environment):


Monitoring in production

The callstacks printed in JDeveloper are also available as runtime diagnostics in a production environment. In the image below an example is shown of a long running ViewObject query (method executeQueryForCollection() ) of 18033 milliseconds (usage name of HRService.EmployeesView1):


A callstack with an example of  a long running activateTransients() and passivateTransients()  - of HRService.LocationViewRO:


In test and production environments, the ADF request call stacks of the ADF Performance Monitor provides similar functionality as the runtime diagnostics of the Oracle ODL Analyzer (by ADF request). The Oracle ODL Analyzer can be useful in the development stage, but can’t be used in test en product environments because of the amount of logging generated and the significant performance overhead. The ADF Performance Monitor records the performance with a very low overhead (less than 4%, caused by the detailed collection of performance metrics).

More information about the ADF Performance Monitor is available on www.adfpm.com.

Wednesday, November 30, 2016

ADF Performance Monitor: Detecting and Analyzing a High ADF BC Memory Consumption

Like other web applications, Oracle ADF applications potentially use a lot of JVM memory. Many times, the root cause of a high memory usage is that application data retrieved from the database into memory is not properly limited; hundreds or thousands of rows (with too many attributes) are fetched and held in ADF BC memory. This can lead to memory over-consumption, very long running JVM garbage collections, a freeze of all current requests or even OutOfMemoryErrors. To make matters worse, these rows and their attributes are frequently retained (passivated and activated) in the session for an unnecessary long period of time. The solution to this problem can be found in reducing the size of sessions by decreasing of the amount of data loaded and held in the session. With a low memory consumption, a more responsive, stable and scalable ADF application can be delivered.

This blog describes one of the new features of the ADF Performance Monitor; a kind of ADF BC memory recorder and analyzer. It detects and warns when too many rows are being fetched (from the database or webservice) and held in ADF BC memory.


ADF BC memory load analyzer of the ADF Performance Monitor

For a selected time range (month, week, day, hour, 5 minute), the tool gives aggregated overviews for each ViewObject instance how many rows have been fetched/loaded into ADF BC memory (ViewObject row cache and entity cache). ViewObjects that frequently fetch hundreds or thousands of rows – and potentially waste memory – can be detected. Individual high fetches/loads can be further analyzed. For each ViewObject, for a selected time range (month, week, day, e.g.), there are the following overviews:

  • The total (sum) of all the ViewObject rows (by ViewObject) that are created in ADF BC memory and fetched from the database. In this overview (screenshot below) ViewObject instances that frequently fetch too many database rows can be detected. The metrics of this example overview is coming from a test server. In this case we can see that ViewObject instance Pagg009ShowAM.GbsVslVO is fetching/retrieving by far the most rows – frequently thousands of database rows. We can see that from mid November 2013 to the end of January 2014 it fetched in total 184.000 database rows (and created 184.000 ViewRowImpl objects). And the highest fetch was 7000 rows in a single HTTP request. This should be a trigger for further investigation.
  • The maximum ViewObject rows (by ViewObject) that are fetched from the database and created (cached) in ADF BC memory in a single HTTP request. In general, to avoid memory over-consumption, very long running JVM garbage collections, a freeze of all current requests or even OutOfMemoryErrors, we should not allow ViewObjects to fetch and load more than ±500 rows. All ViewObject instances that are able to fetch and cache more than ±500 rows should be a candidate for further investigation. In this case (see image below) the same ViewObject instance Pagg009ShowAM.GbsVslVO has fetched the most rows of all ViewObjects in a single HTTP request: 7000 rows. The other ViewObjects that have fetched more than 500 rows should also be investigated.

With these two overviews, ViewObject instances that frequently fetch and load too many database rows can be addressed.
The tool can zoom in and analyze the individual high load (fetch) occurrences of a ViewObject (click on the ViewObject instance name). In the detail overview we can analyze when the high load occurrences happened and how many rows were fetched each time:

Drill down to cal stack of ADF request

We can drill down further to the call stack of the HTTP request. It can be useful to analyze, and find out more details about the circumstances of the high load like: What were the bind parameter values of the ViewObject query? Which ViewCriteria were applied (if one was applied)? Did it happen during ApplicationModule activation? Which taskflow was involved ?

With all this detail information, ViewObject instances that frequently waste ADF BC memory can be addressed. For example by adding extra bind parameters, setting a (better) maximum fetchsize or using Range Paging.


Detecting an overload of ViewObject rows

The metrics classes of the ADF Performance Monitor make use of extension points in the ADF framework in order to measure the time every action/step takes in a http request. It makes use of ADF BC framework extension classes. To measure how many rows are fetched from the database and how many ViewObject rows are created and cached, there are several possibilities:
  • Invoking the getFetchedRowCount() in the BaseViewObjectImpl after the fetch is complete:
                int fetched = viewObjectImpl.getFetchedRowCount();
  • Measuring the population of ViewRowImpl objects in the base BaseViewObjectImpl
And counting them in the BaseViewRowImpl. Before a query is executed (again), you should reset the counter.  You can do this in the executeForCollection(), the method that is invoked before each database query.
  • Overriding the method createRowFromResultSet() and counting them in the BaseViewObjectImpl. This is how the ADF Performance Monitor keeps track of the number of fetched rows and number of ViewRowImpl objects created. Reset the counter before a query is executed (again):

A high load can now be detected in JDevelopers console log. You might want to not log every single row that is fetched but only when you detect a high load.

More information

More details about the ADF Performance Monitor are available on www.adfpm.com.