This blog publishes a new whitepaper that gives detailed information about the architecture and implementation of the ADF Performance Monitor.
History

The first version of the ADF Performance Monitor was created by Frank Houweling and released in 2009. This was first an ADF 10g version; this version consisted of printing performance metrics in JDevelopers console log only (what methods, operations and queries were executed, when and how often). The urgent need of performance visibility came back every time in somewhat all Oracle ADF projects; nearly all ADF applications had performance problems in some way and extreme difficulty in identifying these bottlenecks.

One year later (2010) the second version was released including saving metrics to the database. In 2011 a dashboard application was added that visually reported the performance metrics saved in the database. Last years the monitor has been extensively improved and extended with many new and advanced features.
Over last years the ADF Performance Monitor has been implemented in more than 50 Oracle ADF business production applications – in more than 25 countries in the world; for example in the Netherlands, Germany, Belgium, United Kingdom, France, Spain, Canada, United States, Switzerland, Austria, Romania, Poland, Libanon, Sultanate of Oman, India, China, Australia, Cuba, Mexico, e.g.
New whitepaper published
Whitepaper ADF Performance Monitor - this document gives more information about the architecture and implementation of the ADF Performance Monitor.
Content of the whitepaper:
- Executive overview
- Introduction
- Oracle ADF applications and performance
- ADF Performance Monitor overview
- Use in JDeveloper
- Use in test and production environment
- Dashboard reporting application
- Summary and details HTTP response times
- ADF framework call stack
- Warnings and suggested solutions
- Worst performing executions in ADF BC and model layer
- Error stacktraces
- JVM performance
- Product architecture
- Configuration
- Turn on/off at all times
- Prerequisites
- Monitored Events
Functionality
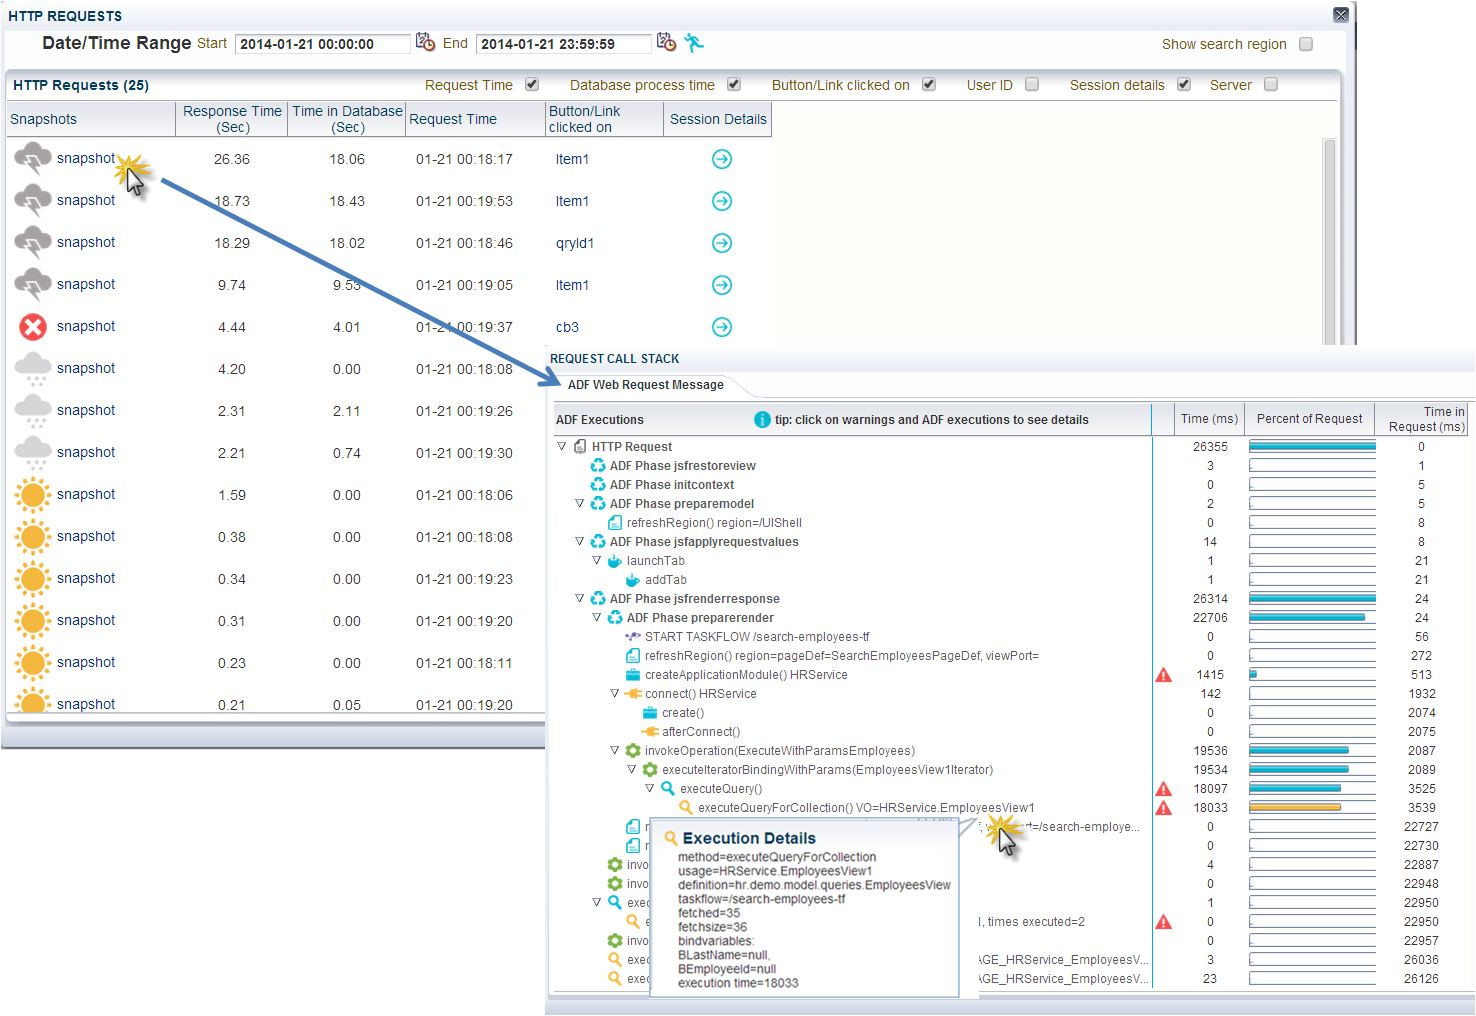
In development, test and production environments, the ADF Performance Monitor provides similar functionality as the callstacks of the Oracle ODL Analyzer (by ADF request). The Oracle ODL Analyzer can be useful in the development stage, but can’t be used in test en product environments because of the amount of logging generated and the significant performance overhead. The ADF Performance Monitor records the performance with a very low overhead (less than 4%, caused by the detailed collection of performance metrics). An example of a callstack in the ADF Performance Monitor is shown in the image below. In this case the bottleneck is a slow ViewObject query of 18033 milliseconds (with usagename HRService.EmployeesView1):
In addition to that, the monitor reports overviews of the worst performing ADF Business Components (shown in the image below), BindingContainer and webservice executions and the possibility to drill down. Extensive help is available in the monitor on how to interpret the metrics. Also JVM metrics and application errors are reported. SLA monitoring (load and HTTP request response times) is possible. Because of the low performance overhead, it is safe to use the ADF Performance Monitor in production environments. The metrics collection can be dynamically turned on and off (at runtime) at all times. When the monitor is turned off there is no performance overhead because the metrics classes are not active. More detailed information is available in the whitepaper published in this blog.

With the ADF Performance Monitor, development, QA and operation teams get insight into what is happening inside their ADF application throughout the whole application lifecycle. With this insight they can circumvent frequent performance problems, use best practices and deliver a responsive and scalable ADF application.