ADF BC framework extension classes
You can instrument your ADF application with the use of ADF BC framework extension classes and overriding specific methods to measure important key actions inside the ADF framework. You can use your project base classes or create a dedicated metrics package with extension classes for performance analysis and tuning. For an ADF BC ViewObject you could create a metrics ViewObject (for example called MetricsViewObject) that extends from oracle.jbo.server.ViewObjectImpl. Your project base class can extend from this MetricsViewObject:Monitor slow queries
You can measure exactly - like a stopwatch - the execution time of a Java method by retrieving the current nano time just before and immediately after the method execution by calling System.nanoTime(). System.currentTimeMillis() can be a few milliseconds inaccurate. See the API doc of System.nanoTime() and System.currentTimeMillis().long startTime = System.nanoTime();
//method being measured ...
long estimatedTime = System.nanoTime() - startTime;
You can look at the ViewObjectImpl API doc for important methods to monitor.
A quick and simple way to monitor executed database queries in ADF is to override the ViewObject method executeQueryForCollection() in your metrics base class. In this way you can monitor which ViewObject queries are executed, their execution time, when and how often. You might detect redundant or unexpected ViewObject queries. With this method you can monitor all queries including queries from ViewAccessors, programmatic ViewObjects, detail queries from ViewLinks, e.g. ).
A ViewObject usage name that contains '_LOCAL_VIEW_USAGE' is a generated ViewAccessor name and is also just a ViewObject query. In JDevelopers console log:
The overriden executeQueryForCollection() method of the ADF Performance Monitor is shown in the image below. The monitor only measures when the monitor is turned on. It has a start-point, and an endpoint in a finally block:
The metrics are collected in a separate object MetricsVoExecution. Extra runtime metrics are collected like bind variable name and values, ViewObject definition name, fetched rows, e.g. to make the metrics even more useful. The execution time is measured in the superclass call super().
Monitor slow select count query
Frequently 'SELECT COUNT (1)' queries are executed by the ADF framework to count the number of rows that would be returned if the View Object is executed with the current query (mainly for tables and trees). This query could be a potential bottleneck if it takes very long to execute, and for this reason the method getQueryHitCount() is useful to monitor:Monitor passivating and activating ViewObject transients
In the same way you can override the activateTransients() and passivateTransients() method. activateTransients() restores attribute values from a ViewObject (if there are transient attributes passivated) and passivateTransients() stores attribute values. Both methods can potentially take a lot of time if the Passivate State - Including All Transient Values checkbox is checked at the ViewObject tuning section:Our performance logging in JDevelopers console log can look like this (I put a delay in the query of the EmployeesView ViewObject of 15 seconds) looks like this:
You might want to look at the ViewObject API to override other interesting methods as well. You can consider to only log metrics when the execution time passes a configurable threshold.
Monitor fetched rows from the database
In my previous about detecting a high ADF BC memory consumption I explained how you can instrument and measure how many rows are fetched from the database, and how many ViewObject rows are created and cached. The most important method to override is createRowFromResultSet() and counting them in the MetricsViewObjectImpl or BaseViewObjectImpl. Reset the counter before a query is executed (again).ADF Performance Monitor
The ADF Performance Monitor uses (amongst others) the extension points and methods described in this blog to measure and record performance. It collects not only execution time but many additional metrics like bind variable name and values, ViewObject definition name, fetched rows, time spent fetching database rows, e.g. . For every HTTP request a so called 'ADF call stack' is printed. These are the methods that we have overridden in our metrics class and other extension points in the ADF framework (in the next parts I will discuss many of them). A call stack provides visibility into which ADF methods caused other methods to be executed, organized by the sequence of their execution. A complete breakdown of the ADF request processing, including all ADF method executions, along with elapsed times is printed, organized by lifecycle phase. ADF developers can switch the metrics logging on and off with the standard ADFLogger of Oracle. The logging of the ADF Performance Monitor in JDeveloper looks like this (for use in a development environment):Monitoring in production
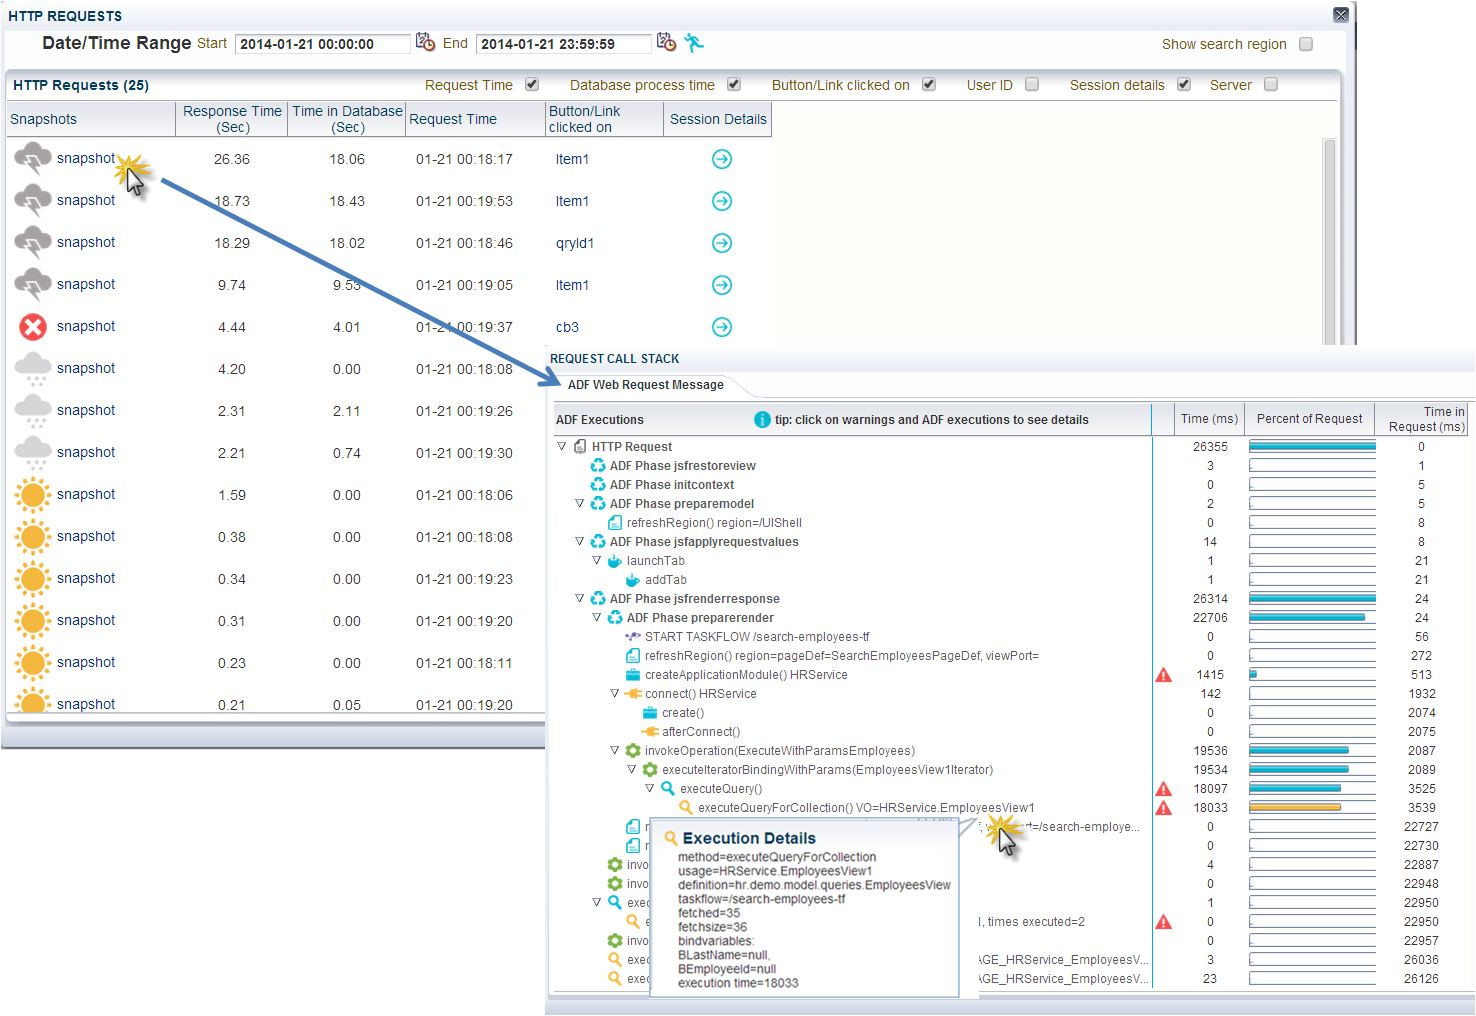
The callstacks printed in JDeveloper are also available as runtime diagnostics in a production environment. In the image below an example is shown of a long running ViewObject query (method executeQueryForCollection() ) of 18033 milliseconds (usage name of HRService.EmployeesView1):A callstack with an example of a long running activateTransients() and passivateTransients() - of HRService.LocationViewRO:
In test and production environments, the ADF request call stacks of the ADF Performance Monitor provides similar functionality as the runtime diagnostics of the Oracle ODL Analyzer (by ADF request). The Oracle ODL Analyzer can be useful in the development stage, but can’t be used in test en product environments because of the amount of logging generated and the significant performance overhead. The ADF Performance Monitor records the performance with a very low overhead (less than 4%, caused by the detailed collection of performance metrics).
More information about the ADF Performance Monitor is available on www.adfpm.com.


